Slovakia’s capital, Bratislava, was the perfect location for our team to conduct an initial test of mobile service quality and speed under real-world conditions. We approached this project as a pilot stage to evaluate our methodology and measurement tools, rather than as a comprehensive assessment of network performance under maximum load. Our primary objective was to gather data on mobile internet, voice call quality, and 5G technology coverage across various areas of the city.
In this article, we present the results of our tests, analyze the collected data, and discuss the methodology employed. These findings provide a solid foundation for further, more detailed analyses and the development of future research projects.
What is the Drive Test method for testing the quality and speed of mobile operators’ services?
The Drive Test method is a technique used to evaluate the quality and performance of mobile networks, particularly regarding internet speed and connection reliability. It involves driving along a predetermined route while recording network performance data at various locations. This approach allows for assessing how well mobile internet functions under real-world conditions—for instance, in areas far from transmitters or during peak traffic hours. Such surveys help operators identify areas where their services may need improvement to enhance the user experience.
What devices were used during mobile Internet measurements in Bratislava?
In the Slovak capital, we conducted Drive Test surveys using 12 smartphones (8 Samsung S21 Ultra smartphones and 4 Samsung S23+ smartphones) and PCTEL Gflex and MXflex scanners.
Which operators were included in the survey?
The study on the quality and speed of mobile networks in Bratislava included four major operators in the Slovak market: Slovak Telekom, O2, Orange, and Swan. Analyzing their networks enabled a comprehensive comparison of the available services and an assessment of their performance under real-world conditions.
It is worth noting that, for tests on call quality and stability, our measuring devices used SIM cards provided directly by the operators (unlimited) for two operators (Slovak Telekom and O2), while for the other two (Swan and Orange), commercially purchased SIM cards (with limits) were used. For mobile internet measurements, three operators—Slovak Telekom, Orange, and O2—provided unlimited SIM cards, whereas Swan’s network was measured using a commercially purchased SIM card. The type of SIM card used may have influenced the measurement results.
What was the driving route like during the Drive Test in Bratislava?
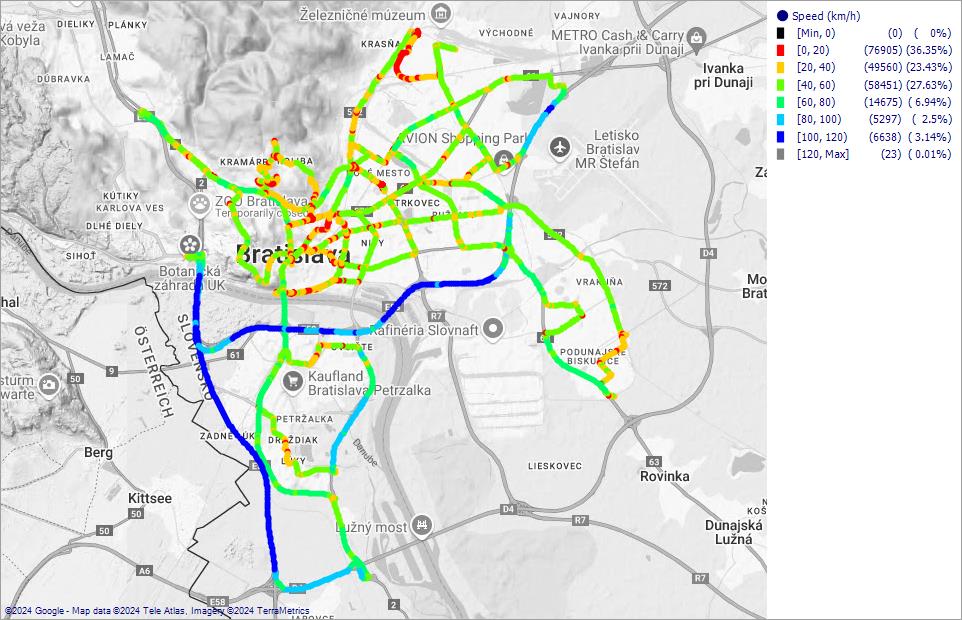
The Drive Test route in Bratislava included both the city’s main thoroughfares and less-traveled local roads, providing a comprehensive assessment of mobile network quality under various conditions. Clearly visible on the map were sections of highways and expressways, marked in blue, where measurements captured high vehicle speeds. These areas, characterized by smooth and fast driving, allowed for testing the network under high-mobility conditions.
In other parts of the city, particularly in the center and densely built-up neighborhoods, the map displayed yellow, orange, and red sections, indicating traffic jams and slowdowns. Congestion was a common issue in Bratislava, especially during rush hours, posing challenges for mobile networks, such as transmitter overload. Testing in these locations enabled an evaluation of network performance under heavy user demand in low-mobility conditions.
The diverse route also allowed for an assessment of internet stability and speed in scenarios that closely mirrored users’ everyday experiences. This comprehensive approach made it possible to compare operator performance across the city.
Audio Quality in Bratislava
Voice calls on mobile networks continue to play an important role, especially in business and private communication. As part of the Drive Test study in Bratislava, the quality of phone calls was evaluated, focusing on key parameters such as the Call Setup Success Rate (CSSR), indicating the effectiveness of establishing calls; the Call Drop Rate (CDR), measuring call interruptions; and audio quality assessed using the Mean Opinion Score (MOS) standard.
Analyzing these data provided a comprehensive evaluation of the reliability and user experience of voice calls offered by individual operators.
Call Setup Success Rate (%) / Call Drop Rate (%)
The Call Setup Success Rate (CSSR) measures the percentage of successfully established calls relative to the total number of call attempts. On the other hand, the Call Drop Rate (CDR) indicates the percentage of calls that were interrupted during their duration. Both are expressed as percentages, with CSSR calculated by dividing the number of successfully established calls by the total number of call attempts, and CDR calculated by dividing the number of dropped calls by the total number of call attempts.
In this category, all operators demonstrated high CSSR values, indicating reliable services for initiating calls. Slovak Telekom and O2 both achieved a CSSR of 99.7%, Orange recorded 99.68%, and Swan achieved 98.09%.
The high quality of voice calls was further confirmed by the low CDR values, with no operator exceeding 0.7%.
Voice Quality According to the MOS Scale (Audio Quality MOS)
The Audio Quality MOS is a standard metric used to evaluate the sound quality of voice calls. It is a subjective measure that reflects how users perceive the quality of a conversation, considering factors such as voice clarity, delays, and transmission disturbances.
The MOS is expressed on a scale from 1 to 5, where:
1 – Very poor sound quality, making the conversation incomprehensible.
2 – Poor quality, with significant communication difficulties.
3 – Satisfactory quality, with minor disruptions.
4 – Good quality, allowing for smooth conversation.
5 – Excellent quality, comparable to face-to-face interaction.
The tests focused on three key metrics:
- Audio Quality MOS Average: The average sound quality based on all tests, reflecting users’ overall satisfaction with call quality.
- Audio Quality MOS < 1.6 (%): The percentage of calls where sound quality was below 1.6 on the MOS scale, making communication uncomfortable.
- Audio Quality MOS DL P90: The sound quality at the 90th percentile, representing call quality under optimal conditions, useful for determining how well a network performs in its best scenarios.
This approach allowed not only an assessment of the average call quality but also the identification of areas where users might encounter communication issues.
In terms of the average Audio Quality MOS, Slovak Telekom achieved the highest score of 4.45 on a 5-point scale. The other operators achieved similar results: O2 ranked second with 3.89, followed by Orange at 3.73, and Swan at 3.15.
The percentage of calls with noticeably low quality was small for all operators, reflecting high reliability and minimal issues for users of these networks. O2 led this ranking with 0.05%, followed by Slovak Telekom at 0.22%. Orange (0.9%) and Swan (1.92%) ranked lower.The final metric in this category was the sound quality at the 90th percentile. These results confirmed the high quality of calls in Bratislava’s urban environment. Slovak Telekom recorded an Audio Quality MOS DL P90 score of 4.7, followed by Orange with 4.14, O2 with 4.13, and Swan with 3.68.
| KPI Free Mode | Voice Drive Test | |||
|---|---|---|---|---|
| Measured parameter | Slovak Telekom | O2 | Orange | Swan |
| Call Setup Success Rate (%) | 99.7 | 99.7 | 99.68 | 98.09 |
| Call Drop Rate (%) | 0.00 | 0.60 | 0.65 | 0.32 |
| Audio Quality MOS Average | 4.45 | 3.89 | 3.73 | 3.15 |
| Handover Success Rate (%) | 98.65 | 99.88 | 99.66 | |
| Average Call Setup Time (s) – MO | 2.100 | 1.790 | 13.070 | 10.160 |
| Average Call Setup Time (ms) – MT | 933 | 522 | 4 099 | 2 636 |
| Audio quality MOS < 1.6 (%) | 0.22 | 0.05 | 0.90 | 1.92 |
| Audio quality MOS P90 | 4.70 | 4.13 | 4.14 | 3.68 |
Measurement of Mobile Internet Speed in Bratislava
As part of the Drive Test study in Bratislava, the speed and reliability of mobile internet services offered by operators were thoroughly analyzed. A wide range of indicators was used to evaluate internet quality, providing a comprehensive assessment of network performance across various usage scenarios.
The evaluation considered the following parameters:
- HTTP File DL Transfer Success Rate (%) and HTTP File UL Transfer Success Rate (%) – Indicators of the success rate for downloading and uploading files over HTTP, reflecting data transfer reliability.
- App DL/UL Throughput avg (Mbps) – Average download and upload speeds in applications, crucial for everyday internet usage.
- App DL/UL Throughput P10 and P90 (Mbps) – Download and upload speeds at the 10th and 90th percentiles, indicating the worst and best user experiences, respectively.
- Web Mean Transfer Time – The average time required to load web pages, reflecting browsing speed.
- Web Mean IP Service Access Time – The average time to access IP services, indicating network responsiveness.
- PING RTT (ms) – Network response time, critical for applications requiring low latency, such as online gaming or video calls.
- Ping Failure Rate (%) – The percentage of failed ping attempts, indicating connection stability.
How fast is the mobile internet in Bratislava?
The measurements indicate that Orange achieved the highest average 5G download speed at 89.96 Mbps and the highest average 5G upload speed at 60.22 Mbps in Bratislava. Slovak Telekom recorded average 5G download and upload speeds of 56.91 Mbps and 56.94 Mbps, respectively.
O2 achieved an average 5G download speed of 66.37 Mbps, slightly higher than Slovak Telekom, but recorded a lower average upload speed of 49.79 Mbps. Swan reported the lowest average speeds, with 32.96 Mbps for download and 29.29 Mbps for upload.
Regarding average ping values, Orange recorded the lowest at 30.97 ms, followed by O2 with 32.1 ms, Swan with 36.56 ms, and Slovak Telekom with 41.64 ms.
It is worth recalling at this point that some of the cards used during the mobile Internet speed measurements (for Swan) were commercial cards, which may have affected the final results.
Web Mean Transfer time and Network Responsiveness
During the Drive Test in Bratislava, measurements of web page load times were also conducted. All operators demonstrated comparable results. Orange achieved the best result with a load time of 4.53 seconds, followed closely by Slovak Telekom at 4.91 seconds. O2 and Swan ranked equally with nearly identical results of 4.93 seconds.
Similar consistency was observed in network responsiveness measurements, assessed via the Web Mean IP Service Access Time metric. All operators delivered comparable results, indicating a similar level of service quality.
| KPI NR/FreeMode | Data Drive Test | |||
|---|---|---|---|---|
| Measured parameter | Slovak Telekom | O2 | Orange | Swan |
| HTTP File DL Transfer Success Rate (%) | 100.00 | 100.00 | 100.00 | 100.00 |
| HTTP File DL Error Count | 0.00 | 0.00 | 0.00 | 0.00 |
| HTTP File UL Transfer Success Rate (%) | 100.00 | 100.00 | 100.00 | 99.66 |
| HTTP File UL Error Count | 0.00 | 0.00 | 0.00 | 1.00 |
| App. DL. Througput avg (Mbps) | 56 907 | 66 369 | 89 958 | 32 976 |
| App DL Throughput P10 (Mbps) | 5 289 | 6 888 | 5 953 | 4 259 |
| App DL Throughput P90 (Mbps) | 164 962 | 196 312 | 245 494 | 108 666 |
| App. UL. Througput avg (Mbps) | 56 936 | 49 792 | 60 224 | 29 286 |
| App UL Throughput P10 (Mbps) | 19 926 | 24 877 | 28 968 | 13 469 |
| App UL Throughput P90 (Mbps) | 84 038 | 73 601 | 84 038 | 46 595 |
| Web Mean Transfer time | 4.91 | 4.93 | 4.53 | 4.93 |
| Web Mean IP Service Access Time | 0.14 | 0.10 | 0.14 | 0.13 |
| PING RTT (ms) | 41.64 | 32.10 | 30.97 | 36.56 |
| Ping Failure Rate (%) | 0 | 0 | 0 | 1 |
5G Technology Coverage Assessed by Scanner
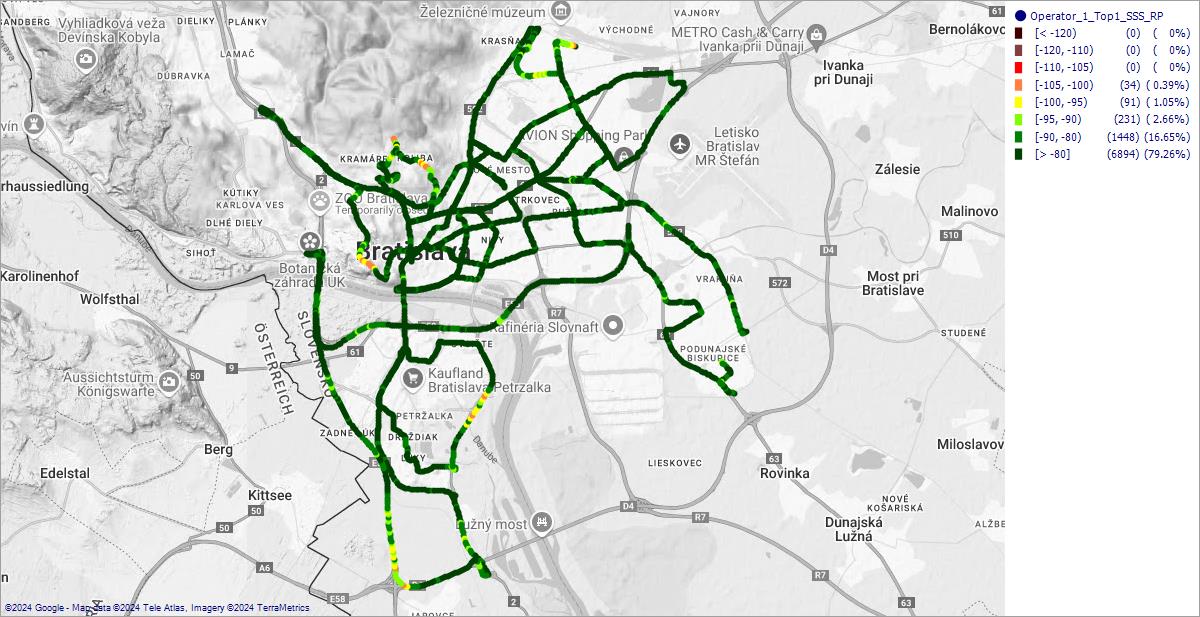
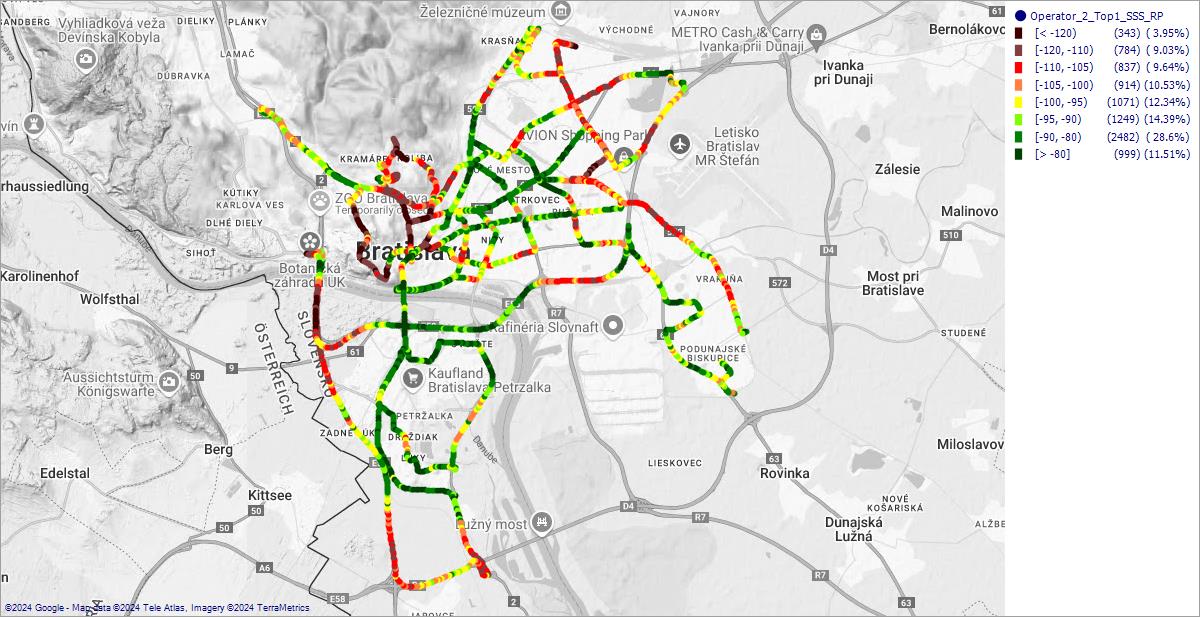
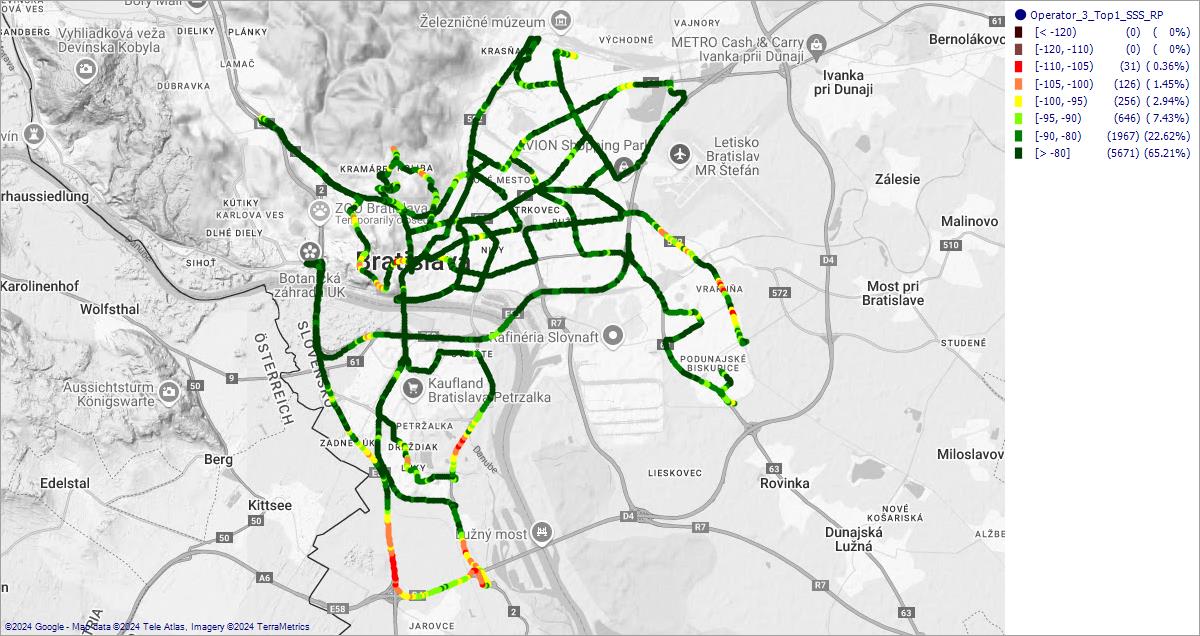
When analyzing the RSRP signal quality in Bratislava, Orange recorded 51.99% of measurements in the very good signal category (> -80 dBm), followed closely by Swan with 51.19%. Both operators also had relatively low percentages of weak signals (< -105 dBm), at 1.71% for Orange and 2.37% for Swan, suggesting consistent network coverage in most locations.
Slovak Telekom had a higher proportion of measurements in the medium signal category ([-90, -80) dBm), with 35.17%, indicating stable service levels in these areas. O2 recorded 48.94% of measurements in the very good signal category (> -80 dBm), but also showed a slightly higher percentage of weak signals (< -105 dBm) at 2.21%. These results highlight variations in signal distribution across the city for each operator.
Below are the coverage maps for 5G technology:
Summary
The Drive Test study conducted in Bratislava offered insights into the quality of mobile services provided by major operators. The voice call analysis showed consistent reliability and stability across all operators, reflected in high Call Setup Success Rate and low Call Drop Rate metrics. Slovak Telekom achieved the highest score on the MOS scale for audio quality, suggesting strong performance in this category.
For mobile internet, Orange recorded the highest average 5G download speed (89.96 Mbps) and upload speed (60.22 Mbps), along with the lowest latency (30.97 ms). O2 followed with competitive download speeds but lower upload performance. Slovak Telekom provided stable upload speeds comparable to its download speeds, while Swan registered the lowest results for both download and upload speeds.
In terms of 5G coverage, Slovak Telekom and Orange showed consistent and stable signals in various parts of the city, with Orange achieving a high percentage of very good signal strength (> -80 dBm). The findings highlight varying strengths and areas for improvement among the operators, providing a snapshot of mobile network performance in Bratislava.
These results provide a solid foundation for further analysis and highlight significant differences in operator performance, particularly in the context of new technologies and user expectations.










Leave a Comment
Your email address will not be published. Required fields are marked with *