


Executive Summary
The year 2025 represented a definitive shift in the Polish telecommunications market, characterized by the normalization of 5G technology as the primary consumer standard. Competitive dynamics were defined by a persistent “dueling leaders” scenario between Orange and T-Mobile. While competition remained tight for the first three quarters, T-Mobile established a clear performance lead in Q4, with mean throughput exceeding the 340 Mbps threshold. In the legacy 4G LTE segment, T-Mobile maintained dominance in downlink performance, while Play secured its position as the leader in uplink throughput.
Sample Size
To provide a statistically significant 12-month market overview, our 2025 analysis aggregated 4,892,534 independent speed tests.
Trough Volume: August (279,479 tests), reflecting the traditional mid-year “summer lull” in user-initiated testing.
Peak Volume: January (497,397 tests), driven by high seasonal digital activity.
Strategic Drivers: Quality and Velocity Trends of Mobile Internet in Poland 2025
Analysis of RFBENCHMARK’s monthly data reveals three critical market pivots in 2025:
- 5G Mainstream Adoption: 5G’s share of total network traffic surged from 22% in late 2024 to nearly 40% by December 2025.
- The 300 Mbps Benchmark: For the first time in the Polish market, two operators (Orange and T-Mobile) maintained average download speeds above 300 Mbps for the majority of the fiscal year.
- Latency Optimization: Average 5G latency (ping) stabilized below 25 ms, positioning mobile infrastructure as a viable alternative to fiber-to-the-home (FTTH) for high-bandwidth, low-latency applications like remote work and cloud gaming.
2025 Aggregated Performance Metrics: 5G Standard
The maturation of the C-Band spectrum has fundamentally transformed the 5G User Experience (UX).
| 5G | ||||
|---|---|---|---|---|
| Measured parameter | Orange | Play | Plus | T-Mobile |
| Download speed | 364.6 Mbps | 211.7 Mbps | 127.1 Mbps | 399.3 Mbps |
| Upload speed | 58.6 Mbps | 51.4 Mbps | 28.0 Mbps | 61.1 Mbps |
| Ping | 19.9 ms | 22.3 ms | 26.5 ms | 22.6 ms |
| Number of measurements | 598391 | 638364 | 364354 | 324260 |
Key Findings in 5G Performance
Responsiveness: Orange emerged as the market leader in network responsiveness with a sub-20ms average (19.9 ms), offering the most stable environment for real-time data exchange.
Throughput Leadership: T-Mobile secured the 2025 Download Velocity title, averaging 399.3 Mbps. Orange followed closely (364.6 Mbps), while Plus continued to lag significantly behind the “Big Three” with 127.1 Mbps.
Uplink Efficiency: A marginal gap exists between T-Mobile (61.1 Mbps) and Orange (58.6 Mbps), indicating high competitive parity in backhaul capabilities.
4G LTE: The Solid Foundation
Despite the 5G expansion, LTE remains the “workhorse” of the industry, facilitating approximately 60% of total data traffic.
- Download Performance: T-Mobile leads (57.9 Mbps), followed by Orange (44.0 Mbps) and Play (42.3 Mbps).
- Uplink Performance: Play maintains its specialized lead in data transmission (22.7 Mbps), narrowly edging out T-Mobile (22.1 Mbps).
- Latency: Orange preserves the lowest latency in the LTE segment at 27.3 ms.
| LTE | ||||
|---|---|---|---|---|
| Measured parameter | Orange | Play | Plus | T-Mobile |
| Download speed | 44.3 Mbps | 42.4 Mbps | 39.9 Mbps | 57.7 Mbps |
| Upload speed | 20.6 Mbps | 22.7 Mbps | 17.9 Mbps | 22.2 Mbps |
| Ping | 27.3 ms | 24.3 ms | 38.9 ms | 30.7 ms |
| Number of measurements | 945247 | 938123 | 514544 | 522988 |
Tabela wyników 5G/4G LTE
| 5G | ||||
|---|---|---|---|---|
| Measured parameter | Orange | Play | Plus | T-Mobile |
| Download speed | 364.6 Mbps | 211.7 Mbps | 127.1 Mbps | 399.3 Mbps |
| Upload speed | 58.6 Mbps | 51.4 Mbps | 28.0 Mbps | 61.1 Mbps |
| Ping | 19.9 ms | 22.3 ms | 26.5 ms | 22.6 ms |
| Number of measurements | 598391 | 638364 | 364354 | 324260 |
| LTE | ||||
|---|---|---|---|---|
| Measured parameter | Orange | Play | Plus | T-Mobile |
| Download speed | 44.3 Mbps | 42.4 Mbps | 39.9 Mbps | 57.7 Mbps |
| Upload speed | 20.6 Mbps | 22.7 Mbps | 17.9 Mbps | 22.2 Mbps |
| Ping | 27.3 ms | 24.3 ms | 38.9 ms | 30.7 ms |
| Number of measurements | 945247 | 938123 | 514544 | 522988 |
Methodology: Transparency in RFBENCHMARK Crowdsourced Analytics
The RFBENCHMARK reporting engine utilizes a crowdsourcing model to capture the authentic User Experience (UX).
Data Acquisition Framework
- Real-World Testing (RWT): Data is collected via the RFBENCHMARK mobile application in natural user environments rather than synthetic laboratory conditions.
- Geospatial Analysis: Every data point is geolocated to provide a granular map of signal quality across the Polish territory.
- Technological Segmentation: Our engine automatically differentiates between 5G, 4G LTE, and 3G standards to ensure data integrity.
Key Performance Indicators (KPIs)
We aggregate and verify data across three core Quality of Service (QoS) pillars:
Network Responsiveness: Latency/Ping testing critical for mission-critical real-time services.takich jak gaming czy wideokonferencje.
Signal Integrity: Monitoring BTS cell load and connection stability.
Bandwidth Throughput: Demand-based measurement of Download and Upload speeds.
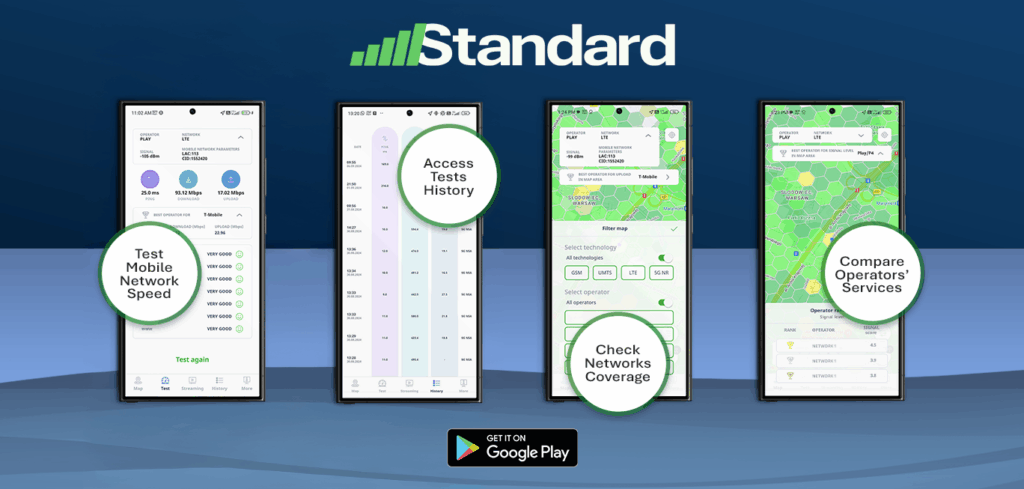
Help shape the future of connectivity. By downloading the RFBENCHMARK app, you contribute critical real-world data to our global network quality mapping.
Download our mobile app for free and join the community!
Recommended Connection Parameters for Seamless Use of Online Services
| Download speed [Mbps] | ||||||
|---|---|---|---|---|---|---|
| Type of service | from 0.1 to 0.3 | from 0.3 to 1 | from 1 to 2 | from 2 to 6 | over 6 | Ping |
| Real-time network games | Less than 30ms | |||||
| Skype calls and VoIP | Less than 150ms | |||||
| Skype video calls/screen sharing | Less than 150ms | |||||
| Skype group video calls (3 people) | Less than 150ms | |||||
| Browsing the web | Less than 200ms | |||||
| Less than 200ms | ||||||
| Other network games | Less than 200ms | |||||
| YouTube video quality 480p, other services SD quality | Less than 200ms | |||||
| YouTube HD video | Less than 200ms |
Example Access Times for Various Online Services Depending on Download Speed
| Download speed | |||||
|---|---|---|---|---|---|
| Type of service | 0.3 Mbps | 1 Mbps | 2 Mbps | 6 Mbps | |
| Opening the website (www.notelit.pl – 1.2 MB) | 32 s | 10 s | 5 s | 2 s | Service access time |
| Downloading email with attachments (5 MB) | 133 s (2min) | 40 s | 20 s | 7 s | Service access time |
| Download the map of Warsaw on Google Maps (3.4 MB) | 91 s | 27 s | 14 s | 5 s | Service access time |
| Flash game loading (3 MB) | 80 s | 24 s | 12 s | 4 s | Service access time |
| Loading audio stream from Wrzuta (6:09 – 10 MB) | 267 s (4 min) | 80 s | 40 s | 13 s | Service access time |
| Loading Full HD video stream from YouTube (2:33 – 40MB) | 1067 s (18 min) | 320 s (5 min) | 160 s (3 min) | 53 s | Service access time |
| Downloading a file from the FTP server (100 MB) | 2667 S (44 min) | 800 s (13 min) | 400 s (7 min) | 133 s (2 min) | Service access time |






Leave a Comment
Your email address will not be published. Required fields are marked with *