

The Notel team’s journey through Poland continues. The objective is clear: to determine which mobile operator in Poland provides the best quality of mobile Internet.
Following our in-depth Drive Test in Warsaw, we’ve collected data in Pomerania. This information will be especially valuable for the numerous tourists who visit the seaside towns annually.
Let’s see if the northern part of Poland is keeping pace with the capital in terms of technological advancement and 5G adoption!
What is a Drive Test mobile Internet survey?
A Drive Test is a method of gathering data on the move. It involves placing measuring devices in a vehicle and travelling along a designated route. This replicates the conditions that residents of a specific city encounter daily.
As in the June Warsaw assessment, we analysed the quality of voice services on popular instant messaging platforms (WhatsApp and Microsoft Teams). We also included a test to see how video content streaming for YouTube and Netflix performs on various mobile networks and simulated e-gaming.
Read also: Quality of mobile Internet in Warsaw – latest Drive Test measurements (June 2023)
What devices were used to measure mobile Internet in Warsaw?
For the research using the Drive Test method, we employed 12 smartphones, of which 8 were Samsung Galaxy S21 Ultra devices. These phones operated on the 5G network and were used to evaluate the quality of voice calls, including standard VoLTE calls, calls via OTT apps using WhatsApp and calls via Microsoft Teams.
During the testing of VoLTE calls and conversations on WhatsApp, we assessed the quality of the transmitted audio. These samples were analysed using the POLQA algorithm version 3.0, which is compatible with HD audio. To mimic typical smartphone usage, we generated network traffic by sporadically downloading 100 KB of data (HTTP download) during the VoLTE voice call tests.
We also used 4 Samsung 23+ devices with active 5G to assess data packages. We focused on services such as:
- Internet speed measurement for file transfer: To evaluate data service performance, we transferred files of 10 MB and 5 MB for both download and upload to and from a cloud-based test server. Moreover, we conducted a data transfer test to and from the server, measuring the volume of data transferred within 10 seconds.
- Display speed of popular websites and a static ‘Kepler’ test page, as defined by the European Telecommunications Standards Institute (ETSI).
- Evaluation of streaming services’ playback quality, including platforms like YouTube and Netflix. Recognising that these services dynamically adjust video resolution based on the available Internet bandwidth, we covered standard HD (1080p) video playback scenarios and tested the network’s capability to deliver 4K UHD content. Our measurements included success rates, video playback start times, and average video resolutions.
- ‘E-gaming’ type measurements, executed using the TWAMP protocol.
Which operators were included in the survey?
We surveyed all Polish mobile operators: Orange, T-Mobile, Plus, and Play. Tests were carried out in FreeMode, where the measuring device utilised the most advanced technology available from the network at the specific location. If 5G was unavailable, the device switched to LTE technology. The data gathered in this way allows us to evaluate the stability of next-generation networks in the tested locations.
What did the driving route look like during the Drive Test?
The driving route included Pomerania’s most frequented holiday spots, visited by millions of tourists each summer season.

Measurement of mobile Internet speed in Pomerania
Download and upload test results
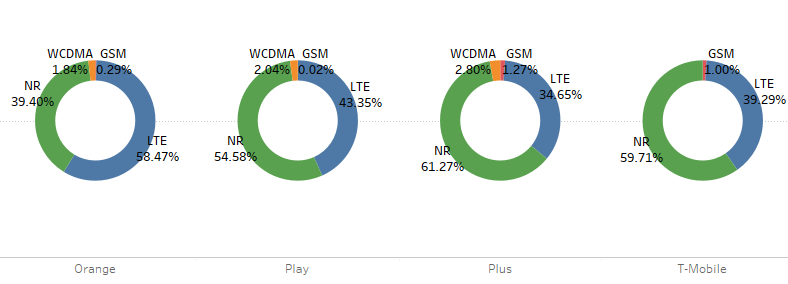
Download and upload tests were conducted using Samsung S23 measurement terminals. Among those used for packet measurements, Plus led the way in 5G technology, securing a 61% share.
This was closely followed by T-Mobile at 60%, Play at 55%, and Orange at 39%.
Regarding data measurement, Plus boasted the highest average HTTP download speed in 10 seconds, clocking in at 63 Mbps. Trailing just behind Plus was Orange with 61 Mbps, followed by Play with 56 Mbps, and T-Mobile with 48 Mbps.
Segmenting by technology, under the 5G (NSA) technology, Plus achieved the top download speed of 87 Mbps, placing it significantly ahead of its rivals. Orange took the second spot with 62 Mbps, marginally outperforming Play’s 59 Mbps. T-Mobile registered the lowest speed at 41 Mbps.
Throughout the entire Drive Test, Play claimed the top spot for the highest average HTTP upload speed in 10 seconds, registering a speed of 26 Mbps. This was followed by T-Mobile at 24 Mbps and Orange at 20 Mbps. Plus trailed in the last position with 18 Mbps.
When considering the 5G NSA HTTP upload speed over the same duration, Play maintained its lead with 34 Mbps. T-Mobile secured the second position with 30 Mbps, while Orange took third place at 27 Mbps. Plus rounded off the list with 24 Mbps.
| 5G NSA + LTE | ||||
|---|---|---|---|---|
| Mierzony parametr | Orange | Play | Plus | T-Mobile |
| HTTP DL 10 sec [Mbps] | 60,70 | 56,09 | 62,63 | 47,83 |
| HTTP UL 10 sec [Mbps] | 20,46 | 26,12 | 18,44 | 24,34 |
| Liczba pomiarów | 347 | 341 | 335 | 339 |
| 5G NSA | ||||
|---|---|---|---|---|
| Mierzony parametr | Orange | Play | Plus | T-Mobile |
| HTTP DL 10 sec [Mbps] | 61,90 | 58,66 | 87,03 | 41,21 |
| HTTP UL 10 sec [Mbps] | 27,26 | 33,96 | 23,75 | 30,17 |
| Liczba pomiarów | 118 | 173 | 172 | 169 |
| 4G | ||||
|---|---|---|---|---|
| Mierzony parametr | Orange | Play | Plus | T-Mobile |
| HTTP DL 10 sec [Mbps] | 60,05 | 53,44 | 33,60 | 54,37 |
| HTTP UL 10 sec [Mbps] | 17,14 | 18,08 | 13,51 | 18,50 |
| Liczba pomiarów | 229 | 168 | 163/ | 170 |
For downloads and uploads of fixed file sizes, specifically 10 MB and 5 MB, Orange clinched the top spot in downloading, registering a speed of 27 Mbps. For the 5 MB file upload, all operators recorded closely matched results around 14 Mbps.
| Rozmiar pliku | Orange | Play | Plus | T-Mobile |
|---|---|---|---|---|
| HTTP DL 10 MB | 27.04 | 18.60 | 16.45 | 13.68 |
| HTTP UL 5 MB | 13.91 | 14.02 | 12.81 | 13.54 |
Latency tests
In the category of the lowest average latency values, including 5G technology (NSA), Play led the pack with an impressive 39 ms. It surpassed T-Mobile, which clocked in at 48 ms. Plus secured the third position with 50 ms, while Orange lagged behind with 53 ms.
Voice calls – VoLTE versus gOTT (Profile: WhatsApp)
As part of our tests, we evaluated standard voice calls (VoLTE) made by operators and compared them with calls made through apps like WhatsApp, Telegram and Viber, all mirroring a WhatsApp audio profile. We conducted approximately 1,000 VoLTE and gOTT calls for each operator.
In terms of call setup issues (like call setup failures), traditional VoLTE calls provided by operators proved to be more dependable than gOTT. However, when considering calls that were dropped mid-conversation (call dropped calls), gOTT connections showcased superior stability.
| Speech type | Orange | Play | Plus | T-Mobile |
|---|---|---|---|---|
| Voice | 433 | 544 | 532 | 549 |
| gOTT | 425 | 513 | 444 | 538 |
| Speech type | Orange | Play | Plus | T-Mobile |
|---|---|---|---|---|
| Voice | 1 | 6 | 2 | 0 |
| gOTT | 2 | 13 | 3 | 1 |
| Speech type | Orange | Play | Plus | T-Mobile |
|---|---|---|---|---|
| Voice | 7 | 14 | 4 | 6 |
| gOTT | 2 | 8 | 23 | 1 |
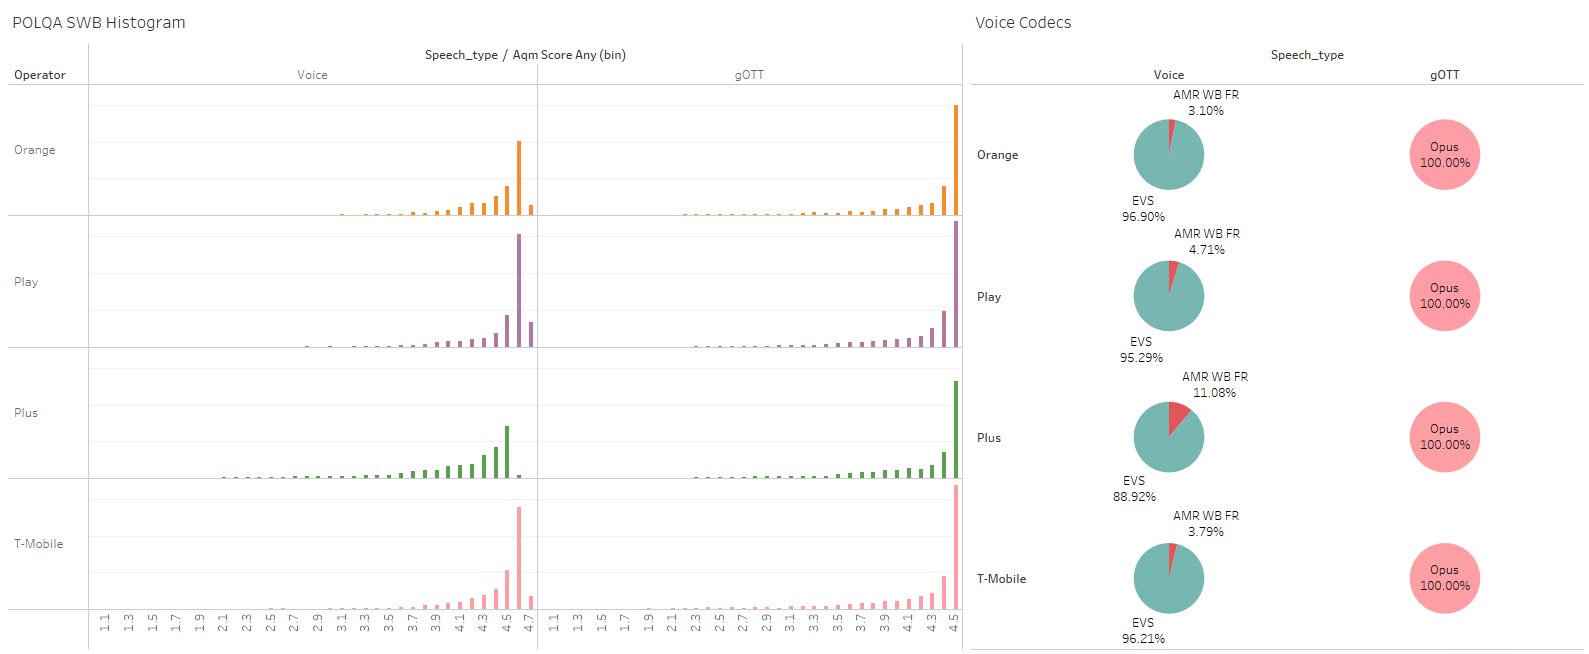
For both VoLTE and gOTT – specifically WhatsApp calls – we assessed the audio quality of transmitted speech samples using the POLQA algorithm version 3.0, supporting HD audio and dedicated to gauging voice quality in OTT calls.
The chart below demonstrates that gOTT voice calls, when modelled on a WhatsApp profile, deliver voice quality on par with the traditional (VoLTE) calls offered by operators.
All operators, as in Warsaw, recorded excellent voice quality results. This includes Plus, which has recently been the latest to adopt the new EVS codec on its network. This codec plays a pivotal role in enhancing the quality of VoLTE voice calls. It’s worth noting that using this codec on the Plus network may require updating the phone’s firmware to the latest version. Thus, all operators in Poland now offer calls using the EVS codec, marking a significant improvement in call quality.
Voice Quality Score – MOS
Voice quality was assessed using the 5-point MOS scale, where MOS (Mean Opinion Score) represents a subjective evaluation of speech quality made at the receiving end after the speech signal has passed through the transmission channel. The 5-point scale breaks down quality as:
- 5 – excellent quality (ability to relax, conversation requires no effort to understand the speaker),
- 4 – good quality (conversation requires concentration but does not require significant effort to understand the speaker),
- 3 – acceptable quality (conversation requires moderate effort to understand the speaker),
- 2 – poor quality (conversation requires considerable focus and effort to understand the speaker),
- 1 – unacceptable quality (despite focus and considerable effort, understanding the speaker during the conversation is impossible).
Voice call quality for videoconferencing (Microsoft Teams)
The Drive Test also included voice calls made between terminals via the popular videoconferencing platform, Microsoft Teams. The data shown below is from the terminal initiating the call.
Our analysis considered both packet loss and jitter. Jitter, measured in milliseconds (ms), illustrates the fluctuation in the PING parameter, acting as an indicator of anomalies in the data transmission process. Irregular delays can pose challenges for applications that rely on consistent transmission, such as gaming or live streaming. This highlights the importance of maintaining minimal jitter values. Orange achieved the least packet loss at 0.7%, while both Plus and Play operators registered the lowest jitter at 12.3 ms. T-Mobile lagged behind with the highest packet loss of 1.5% and the most pronounced jitter at 15.7 ms.
We also analysed the Concealed Sample Rate, which indicates the percentage of audio samples concealed during transmission or reception, providing information about audio quality. It expresses the ratio of audio frames containing samples generated by the packet loss concealment mechanism relative to the total number of audio frames. From this analysis, Plus and Play emerged as leaders in audio quality, registering values of 1.9% and 2.2%, respectively. For Orange, 2.7% of audio frames contained concealed samples, while for T-Mobile, this figure stood at 3.1%.
We also obtained data on Round Trip Time (RTT). Round Trip Time is the duration from the moment a web browser sends a request to a server (e.g., when opening a web page) until the server responds and the browser receives the response. This parameter is measured in milliseconds. Both T-Mobile and Play boasted the most efficient connections, with Play recording an RTT of 140 ms and T-Mobile closely following at 141 ms.
Streaming services – YouTube and Netflix
Within our research, we delved into the user experience on streaming platforms.
We analysed the average video resolution streamed from YouTube and Netflix. This is calculated as the average resolution of the image in pixels (p) that was displayed on the user’s screen. It’s worth noting that while consuming content on these platforms, the video’s resolution dynamically adapts in response to fluctuations in Internet connection quality. For instance, during a single viewing session, a user might encounter both 720p and 480p resolutions. In such scenarios, the session’s average resolution is determined as the midpoint between 720p and 480p.
For Netflix streaming, the operators Plus (624p) and T-Mobile (591p) secured the top spots in terms of average resolution. When it came to YouTube, T-Mobile led with a resolution of 2033p, closely followed by Plus at 2009p.
Average resolution
In terms of streaming quality, we also analysed the Success Rate, which represents the frequency of successful streaming attempts. This metric is defined as the ratio of successful streaming attempts to total streaming attempts.
Across the board, all operators recorded a higher success rate for Netflix compared to YouTube. For Netflix, Plus and T-Mobile led the pack with success rates of 95% and 94%, respectively. In contrast, for YouTube, T-Mobile and Play had the highest success rates of 79% and 73%, respectively.
Seamless video streaming also means uninterrupted video playback. We compared the percentage of sessions that lasted without interference. For both streaming platforms, Orange clinched the top spot with the highest percentage of disruption-free sessions (96% for Netflix and 88% for YouTube). We also checked the cumulative duration of all interruptions during our tests. Orange had the shortest total interruption time on YouTube at 44 seconds, while T-Mobile had the shortest time on Netflix, clocking in at 3 minutes.
| Streaming Service | Orange | Play | T-Mobile | Plus |
|---|---|---|---|---|
| YouTube | 71,5% | 73,4% | 79,2% | 69,8% |
| Netflix | 92,8% | 91,8% | 93,7% | 95,8% |
| Streaming Service | Orange | Play | T-Mobile | Plus |
|---|---|---|---|---|
| YouTube | 88,1% | 73,3% | 86,1% | 80,4% |
| Netflix | 96,1% | 95,3% | 89,3% | 94,1% |
Success Rate
Another parameter, relevant from the user’s perspective, is the time between the start of video playback and the actual display of the first frame or sound. Contrary to video playback interruptions, we observed that users typically experience longer wait times with Netflix compared to YouTube. The shortest average playback start time for Netflix was recorded on T-Mobile (2.15 s) and Plus (2.2s). For YouTube, playback started the fastest on Orange (0.08s) and Plus (0.17s).
Video playback start delay
We also checked the average throughput during streaming sessions. Throughput is a measure of the volume of data that is transmitted over a communication channel within a specified timeframe, factoring in potential losses and delays.
The best throughput result for Netflix was achieved by Orange and Play (9.3 Mbps and 8.2 Mbps, respectively). For YouTube, T-Mobile and Orange led the way with throughputs of 22.6 Mbps and 21.1 Mbps, respectively.
Throughput (THR)
Page opening time
We also measured the time taken to load webpages. For the static Kepler reference page, as defined by ETSI, Plus emerged as the frontrunner with an average load time of 1.3 seconds. Orange recorded a load time of 1.4 seconds, while both Play and T-Mobile clocked in at 1.6 seconds.
TWAMP test – e-gaming
We also conducted measurements related to e-gaming activities.
We gauged network efficiency using the Interactivity Score parameter. This metric evaluates the two-way delay for each UDP packet sent and received, offering insights into the responsiveness of user actions and the associated latency. The outcome is rated on a scale ranging from 0 to 100.
During the interactivity test, both Plus and Play networks performed exceptionally well, with an average Interactivity Score of 64 and 62 points, respectively. The lowest Interactivity Score of 53 points was recorded on the Orange network.
We also evaluated Round Trip Time and Packet Loss. Packet loss occurs when data transmitted between your computer and a server gets lost along the way. Packet loss can lead to unexpected lags and in-game disruptions.
The lowest packet loss was observed on the Plus (7.4%) and Play (7.6%) networks. Regarding RTT, Play achieved the most efficient result, clocking in at 39.3 ms.
Key findings of the Drive Test in Pomerania (2023)
At the end of July 2023, a measurement of mobile network quality was conducted in northern Poland, targeting popular tourist destinations.
In contrast to previous measurements in Warsaw, this time around, 5G coverage was available for Plus and T-Mobile on 60% of the measurement route. For Play and Orange, the figures stood at 55% and 40%, respectively. From the provided maps, it can be seen that the measurement route includes popular towns and cities where certain operators lack 5G coverage.
For Orange and T-Mobile, the absence of 5G coverage is particularly evident in the West Pomeranian Voivodeship and in towns such as Jastrzębia Góra and Łeba. Additionally, for Orange, towns like Puck and Ustka also show a noticeable lack of 5G coverage.
All operators face challenges in ensuring continuous 5G coverage on roads connecting tourist destinations in northern Poland. Specifically, the discontinuity of 5G coverage is apparent on national roads and expressways like S3 and S6.
One location that experiences network congestion during the height of the tourist season or suffers from insufficient radio coverage is the much-frequented Hel Peninsula. During our drive-through measurements on the peninsula, HTTP 10-second download speeds were recorded as follows: 46 Mbps for Orange, 40 Mbps for T-Mobile, 16 Mbps for Plus, and 13 Mbps for Play.
Consistent with previous analyses, the Plus network continues to outperform in terms of potential Internet download speeds, achieving 63 Mbps with 60% 5G coverage. When it comes to uploads, Play leads the pack with 26 Mbps and 55% 5G coverage.
It’s worth highlighting that the current measurements compare the quality of traditional voice services (VoLTE) with those offered through popular OTT applications like WhatsApp and Microsoft Teams. The infrastructure of all operators facilitates high-quality voice calls for these OTT applications.
A new addition to our assessment is the evaluation of network quality for online gaming access services. Here, factors like latency and packet loss play a pivotal role. The TWAMP – Interactivity Score test offers valuable insights in this context.
Given the rising popularity of e-sports and online gaming, there’s a pressing need for operators to provide top-tier connections that minimise latency and packet loss. In this light, the results from the TWAMP test become instrumental in evaluating the service quality of individual operators.


Leave a Comment
Your email address will not be published. Required fields are marked with *