

As digital offices become the norm and autonomous vehicles are no longer just a fantasy, the quality of Internet connection becomes a determining factor in the standard of living. Welcome to Warsaw, a city we’ve analysed in terms of mobile network quality and speed.
Is the capital as ‘online’ as we anticipate? Has 5G evolved from a mere advertising slogan into a widespread service that genuinely meets our needs?
Our Drive Test survey will provide you with facts that offer a fresh perspective on the state of mobile Internet in Warsaw.
What is a Drive Test mobile Internet survey?
This method involves data collection on the go, using measuring devices installed in a vehicle. This approach provides a representation of the conditions very close to what the residents of a particular city experience daily.
For the first time in the history of our surveys, we included new types of services in our measurements, such as the quality of voice services on popular instant messaging platforms (WhatsApp and Microsoft Teams). We also incorporated a test to assess how video content streaming for Netflix performs on various mobile networks. We also added the e-gamer experience to our measurement scenario.
What devices were used to measure mobile Internet in Warsaw?
For the Drive Test survey, we used 12 smartphones and a PCTEL Gflex scanner. The smartphones included 8 Samsung Galaxy S21 Ultra devices, operating on 5G technology, which we used to test voice calls. We distinguished between standard voice calls – VoLTE, generic OTT application (gOTT) voice calls with a WhatsApp profile, and voice calls using Microsoft Teams.
We assessed the sound quality of transmitted speech samples during VoLTE calls and WhatsApp calls. These samples were evaluated using the POLQA broadband algorithm version 3.0, which supports HD voice. To simulate typical smartphone usage scenarios, we randomly downloaded a 100 KB data packet over time (HTTP download) in the background during the VoLTE voice call tests.
We also used 4 Samsung S23+ devices with active 5G to measure data packages. We focused on services such as:
- Internet speed measurement for file transfer: to test data service performance, we transferred 10 MB and 5 MB download and upload files from or to a cloud-based test server. Additionally, we performed a data transfer test to and from the server, measuring the amount of data transferred in 10 seconds.
- Display speed of popular websites and a static ‘Kepler’ test page, as defined by the European Telecommunications Standards Institute (ETSI).
- Evaluation of streaming services’ playback quality, such as YouTube and Netflix. We considered the fact that these services dynamically adapt video resolution according to the available Internet bandwidth, covering typical HD (1080p) video playback scenarios and testing the network’s ability to deliver 4K UHD content. Therefore, our measurements included success rates, video playback start times, and average video resolution.
- ‘E-gaming’ type measurements, implemented using the TWAMP protocol.
Which operators were included in the survey?
We surveyed all Polish mobile operators: Orange, T-Mobile, Plus, and Play. Tests were conducted in FreeMode, where the measuring device utilised the most advanced technology offered by the network at the given location. If 5G was unavailable, the device switched to LTE technology. The data collected in this manner enables us to assess the stability of next-generation networks in the tested locations.
What did the driving route look like during the Drive Test?
The driving route encompassed the most critical arteries and traffic routes of the Polish capital, located on both sides of the Vistula River.

Measurement of mobile Internet speed in Warsaw
Download and upload test results
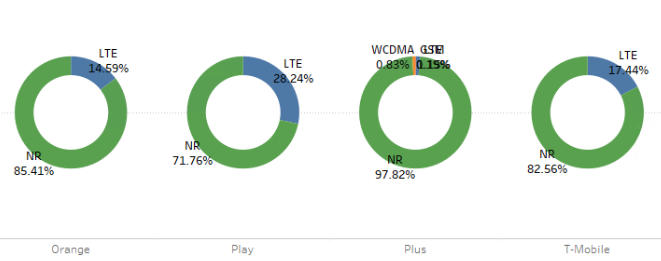
Download and upload tests were conducted using Samsung S23 measurement terminals. Among those used for packet measurements, Plus achieved the highest percentage for 5G technology, scoring 98%. This was followed by Orange (85%), T-Mobile (83%), and Play (72%).
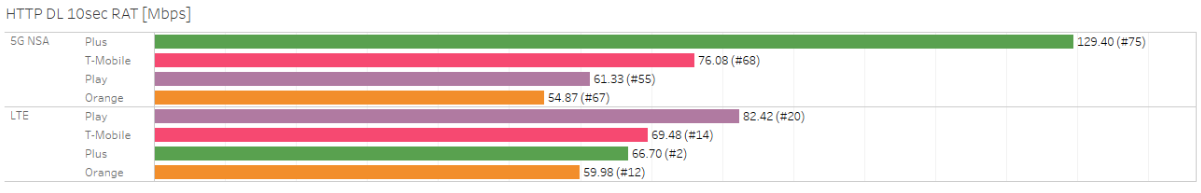
In terms of data measurement, Plus achieved the highest average HTTP download speed in 10 seconds under 5G technology (NSA), with a score of 129.4 Mbps. This put the operator far ahead of its competitors. T-Mobile came in second place (76.1 Mbps), slightly better than Play (61.3 Mbps), while Orange recorded the lowest result (54.9 Mbps).
For the highest average 5G NSA HTTP upload speed in 10 seconds, T-Mobile took the lead with a score of 51.80 Mbps. Play came in second (51.07 Mbps), followed by Orange (44.05 Mbps). Plus ranked last, scoring 33.92 Mbps.
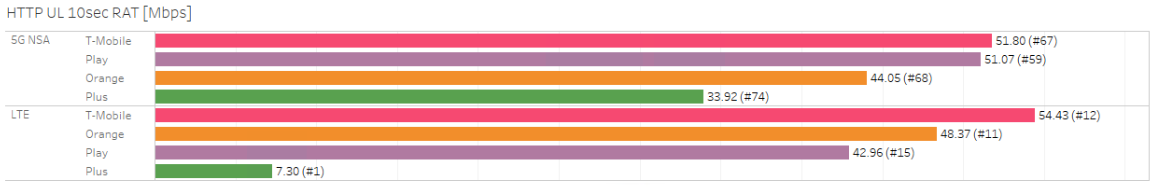
When downloading and uploading fixed file sizes of 10 MB and 5 MB, the speeds were significantly lower than in the 10-second fixed time download and upload test. Despite these differences, Plus also took first place in this specific test of downloading a file, scoring 50 Mbps. For uploading a 5 MB file, T-Mobile took first place, as in the 10-second data upload scenario, scoring 42 Mbps.
| File size | Orange | Play | Plus | T-Mobile |
|---|---|---|---|---|
| HTTP DL 10 MB | 35.5 | 37.9 | 50.5 | 33.5 |
| HTTP UL 10 MB | 35.1 | 37.5 | 30.3 | 42.1 |
Latency tests
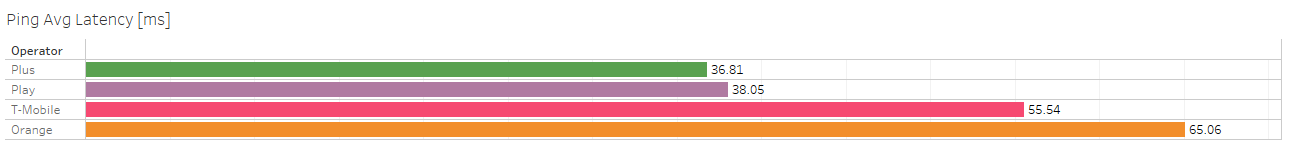
In the category of the lowest average ping value, including 5G (NSA) measurement, Plus came out on top with a score of 36 ms. It was closely followed by Play, which scored 38 ms. T-Mobile came in third with 55 ms, and Orange recorded the worst result with 65 ms.
Voice calls – VoLTE versus gOTT (Profile: WhatsApp)
We tested voice calls made using standard operator protocols (VoLTE) and compared them with the increasingly popular voice calls made via OTT messengers like WhatsApp, Telegram, and Viber. In our case, we used a generic OTT client with an audio profile corresponding to WhatsApp. We made over 400 VoLTE and gOTT calls for each operator.
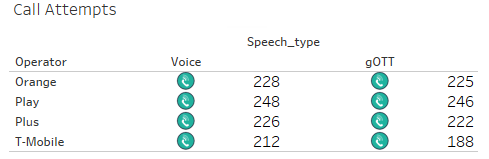
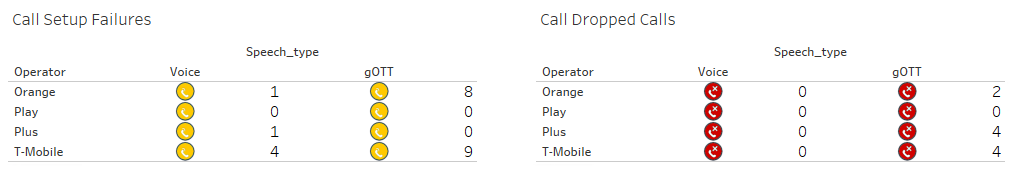
When comparing the number of issues during call setup (call setup failures) and dropped calls during the conversation (call dropped calls), traditional VoLTE calls offered by operators were more reliable compared to gOTT. However, for Play, we observed no call setup or call drop issues for both call types. For T-Mobile, there were more VoLTE or gOTT call setup problems compared to other operators.
For VoLTE and gOTT – WhatsApp calls, we measured the sound quality of transmitted speech samples using the POLQA algorithm version 3.0, supporting HD voice and dedicated to measuring voice quality in OTT calls.
The chart below demonstrates that gOTT voice calls using a WhatsApp profile provide voice quality comparable to traditional (VoLTE) calls offered by operators.
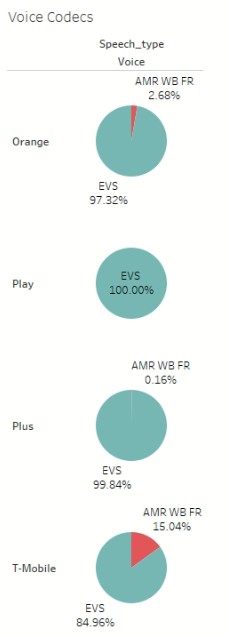
All operators recorded excellent voice quality results, including Plus, which has recently been the last to introduce the new EVS codec on its network. This codec significantly impacts the quality of VoLTE voice calls offered. Please note that using this codec on the Plus network may require updating the phone’s firmware to the latest version. Thus, all operators in Poland now offer calls using the EVS codec, greatly improving call quality.
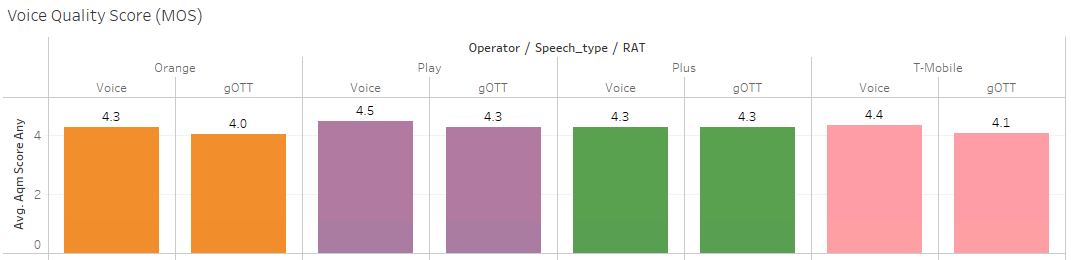
Voice quality was assessed using the 5-point MOS scale, where MOS (Mean Opinion Score) is a subjective evaluation of speech quality made at the receiving end after the speech signal has passed through the transmission channel. The 5-point scale assesses quality as follows:
- 5 – excellent quality (ability to relax, conversation requires no effort to understand the speaker),
- 4 – good quality (conversation requires concentration but does not require significant effort to understand the speaker),
- 3 – acceptable quality (conversation requires moderate effort to understand the speaker),
- 2 – poor quality (conversation requires considerable focus and effort to understand the speaker),
- 1 – unacceptable quality (despite focus and considerable effort, understanding the speaker during the conversation is impossible).
Voice call quality for videoconferencing (Microsoft Teams)
The Drive Test also included voice calls between terminals using a popular videoconferencing platform, Microsoft Teams. This test was conducted for each operator.
Our engineering team innovatively designed a measurement tool to perform a customised test. This tool utilised the native Microsoft Teams application to set up voice calls and measure their quality.
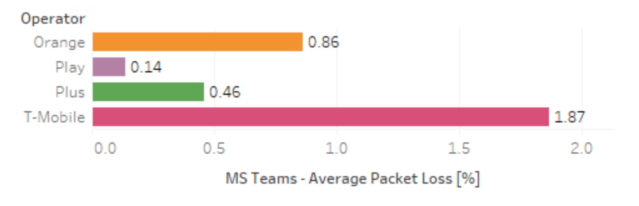
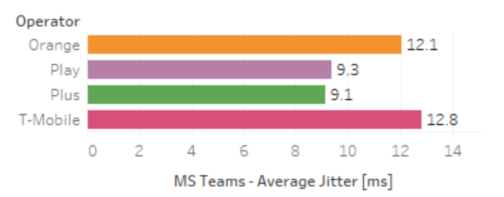
Play and Plus emerged with the highest call quality, distinguished by the lowest packet loss (Play: 0.14%, Plus: 0.46%) and the lowest jitter (9ms for both operators).
Jitter, recorded in milliseconds (ms), illustrates the fluctuation in the PING parameter, acting as an indicator of anomalies in the data transmission process. Irregular delays can be problematic for applications requiring continuous transmission, like games or online broadcasts, emphasising the importance of maintaining minimal jitter values.
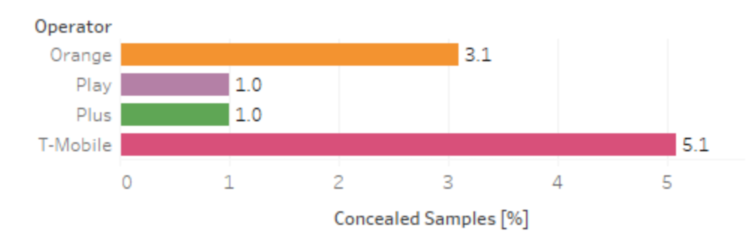
We also analysed the Concealed Sample Rate, which indicates the percentage of audio samples concealed during transmission or reception, providing information about audio quality. It expresses the ratio of audio frames containing samples generated by the packet loss concealment mechanism to the total number of audio frames. From this, it can be inferred that Plus and Play had the highest audio quality, as this parameter’s values were 1% for both operators. In contrast, for Orange, concealed samples were found in 3.1% of audio frames, and for T-Mobile, this was 5.1%.
Plus, Play, and T-Mobile were also characterised by the shortest Round Trip Time (105ms for Plus, 115ms and 116ms for T-Mobile and Play respectively).
Round Trip Time is the duration from the moment a web browser sends a request to the server (e.g., when opening a web page) until the server responds and the browser receives the response. This parameter is measured in milliseconds.
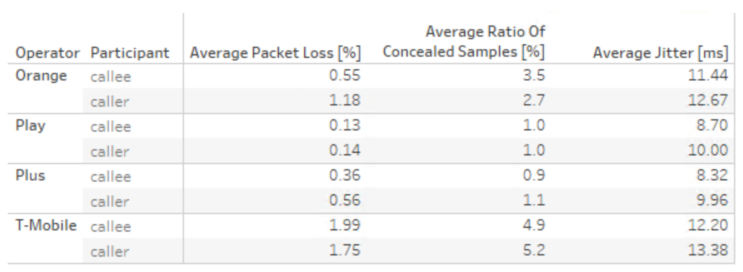
For the receiving side of the MS Teams call, Orange, Play, and Plus typically experienced less packet loss than T-Mobile. On average, all operators exhibited less jitter on the receiving side.
Streaming services – YouTube and Netflix
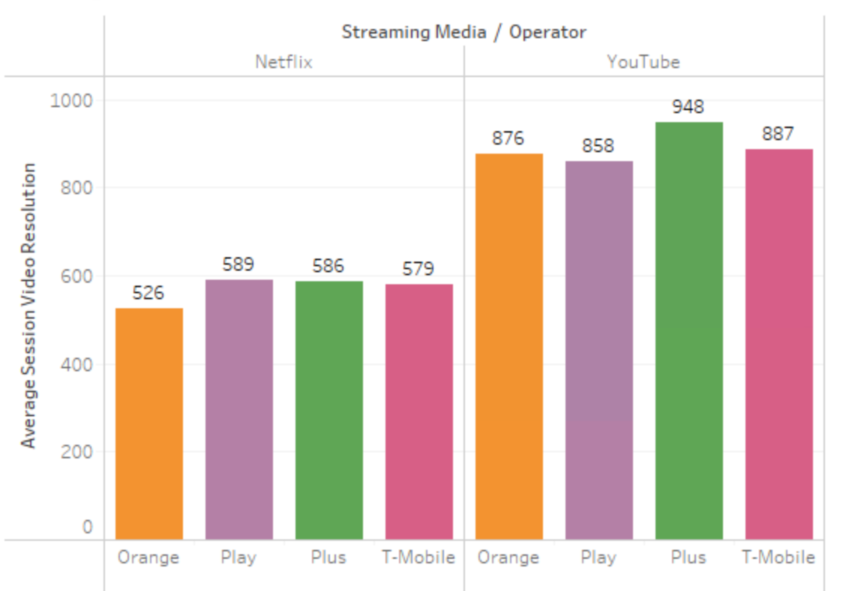
The next stage of the Warsaw Drive Test involved comparing the average resolution of video streamed from YouTube and Netflix. For streaming from Netflix, the highest average resolutions were achieved by Play (589p) and Plus (586p), followed by T-Mobile (579p), with Orange lagging behind (526p). For YouTube streaming, Plus boasted the highest video resolution (948p), outperforming the other operators.
The highest throughput for streaming from YouTube was recorded on the Plus network, reaching 6.78 Mbps. Other operators had similar, though lower, values (Orange: 4.21 Mbps, T-Mobile: 4.26 Mbps, Play: 4.33 Mbps).
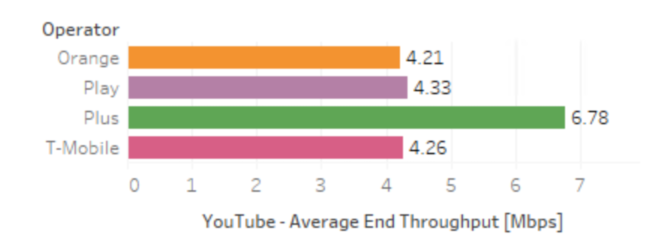
Average end-to-end throughput measures the amount of data that can be transmitted from the origin to the destination in a given time frame. This measure can help diagnose problems with an Internet connection, like verifying if the data speed can support demanding applications such as video streaming or online gaming.
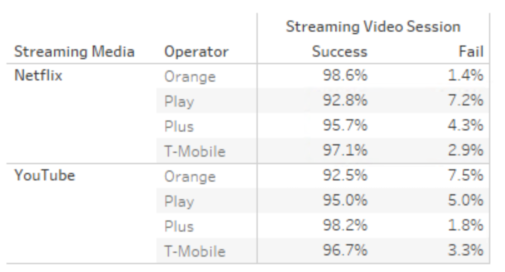
Regarding streaming quality, we also analysed the Success Rate, which refers to the frequency of successful streaming attempts. It’s defined as the ratio of successful streaming attempts to total streaming attempts.
All operators managed to achieve a score above 92% successful streams, irrespective of the application tested. For Netflix, Orange and T-Mobile scored the highest success rates (99% and 97% respectively), while for YouTube, Plus and Play achieved superior results (98% and 97% respectively).
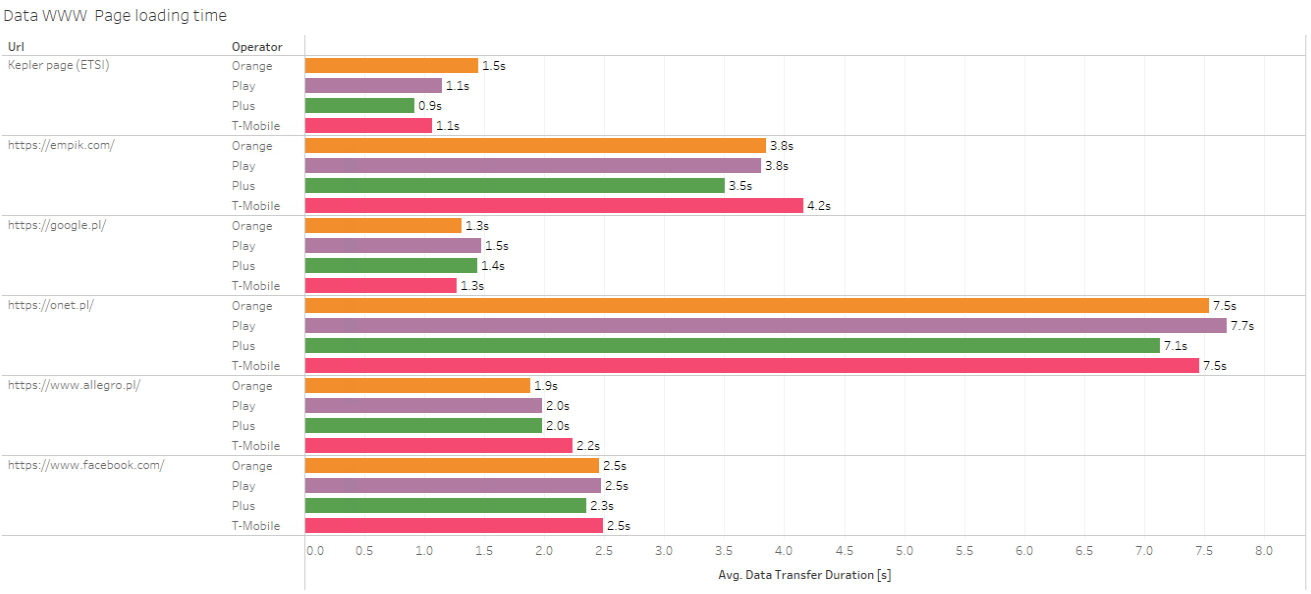
Page opening time
We also measured the web page opening service. For the static Kepler reference page (as per ETSI definition), Plus was the best performer, taking less than a second on average (precisely 0.9 seconds). The other operators surpassed this benchmark, recording the following results: Play and T-Mobile (1.1 seconds), Orange (1.5 seconds).
TWAMP test – e-gaming
The Drive Test included measurement of extremely popular e-gaming activities, providing a broader view of which network facilitates smooth gameplay synchronised over the Internet with other players.
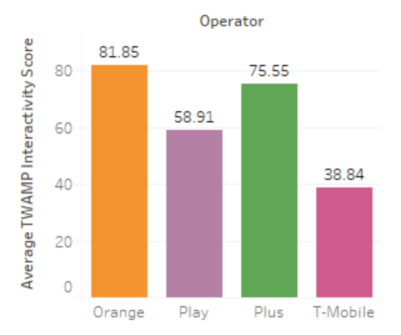
Network efficiency was evaluated with the Interactivity Score parameter, which considers a two-way delay measurement for each UDP packet sent and received. This indicator provides information on whether a user receives a response to their actions and how quickly it happens. The measurement is assigned a score on a scale from 0 to 100.
In the interactivity test, Orange and Plus networks excelled as the best performers, with average Interactivity Scores of 82 and 76 points respectively. The lowest Interactivity Score of 39 points was recorded on the T-Mobile network.
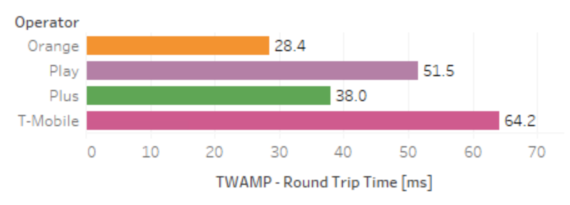
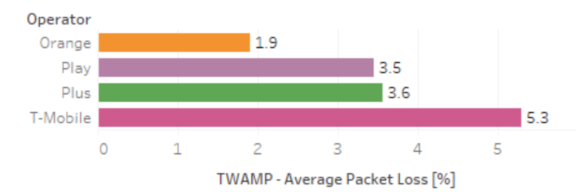
We also evaluated Round Trip Time and Packet Loss. We observed the lowest values for both parameters on the Orange network (28ms RTT, 1.9% Packet Loss) and the highest values on the T-Mobile network (64ms RTT and 5.3% Packet Loss).
Packet loss happens when information sent between your computer and a server (such as in gaming) gets lost along the way. Similar to high ping values, packet loss can cause sudden slowdowns and issues in the game.
5G technology coverage for PCTEL Gflex scanner measurement
During the Drive Test, we employed a PCTEL Gflex scanner to accurately measure the range for each operator. The scanner was configured in automatic detection mode to identify available technologies and frequencies. Here are the coverage maps for 5G technology:

From the data collected with the measurement scanner, it’s evident that the Plus operator possesses the most 5G base stations within the coverage area (522 unique cells). T-Mobile and Orange, sharing the same physical base station locations, each have 415 unique 5G cells. The smallest number of unique cells was recorded by Play (364).
| Operator | NRARFCN | Band | Frequency (MHz) | Cell Identities (Unique) | Sync Beams (Unique) | PSS RP (dBm) (Avg) | PSS RQ (dB) (Avg) | PSS SINR (dB) (Avg) |
|---|---|---|---|---|---|---|---|---|
| Plus | 518910 | 41 | 2594.55 | 522 | 522 | -88.5 | -13.4 | 5.0 |
| Orange | 423410 | 1 | 2117.05 | 415 | 418 | -78.2 | -12.9 | 6.4 |
| T-Mobile | 426050 | 1 | 2130.25 | 415 | 418 | -78.5 | -12.7 | 6.9 |
| Play | 432356 | 1 | 2161.78 | 364 | 372 | -80.4 | -14.1 | 2.3 |
These discrepancies in the number of base stations can also be observed in the breakdown of 5G technology usage during the earlier presented measurement. Plus had a 98% use of 5G technology, followed by Orange at 85%, T-Mobile at 83%, and Play trailing at 72%.
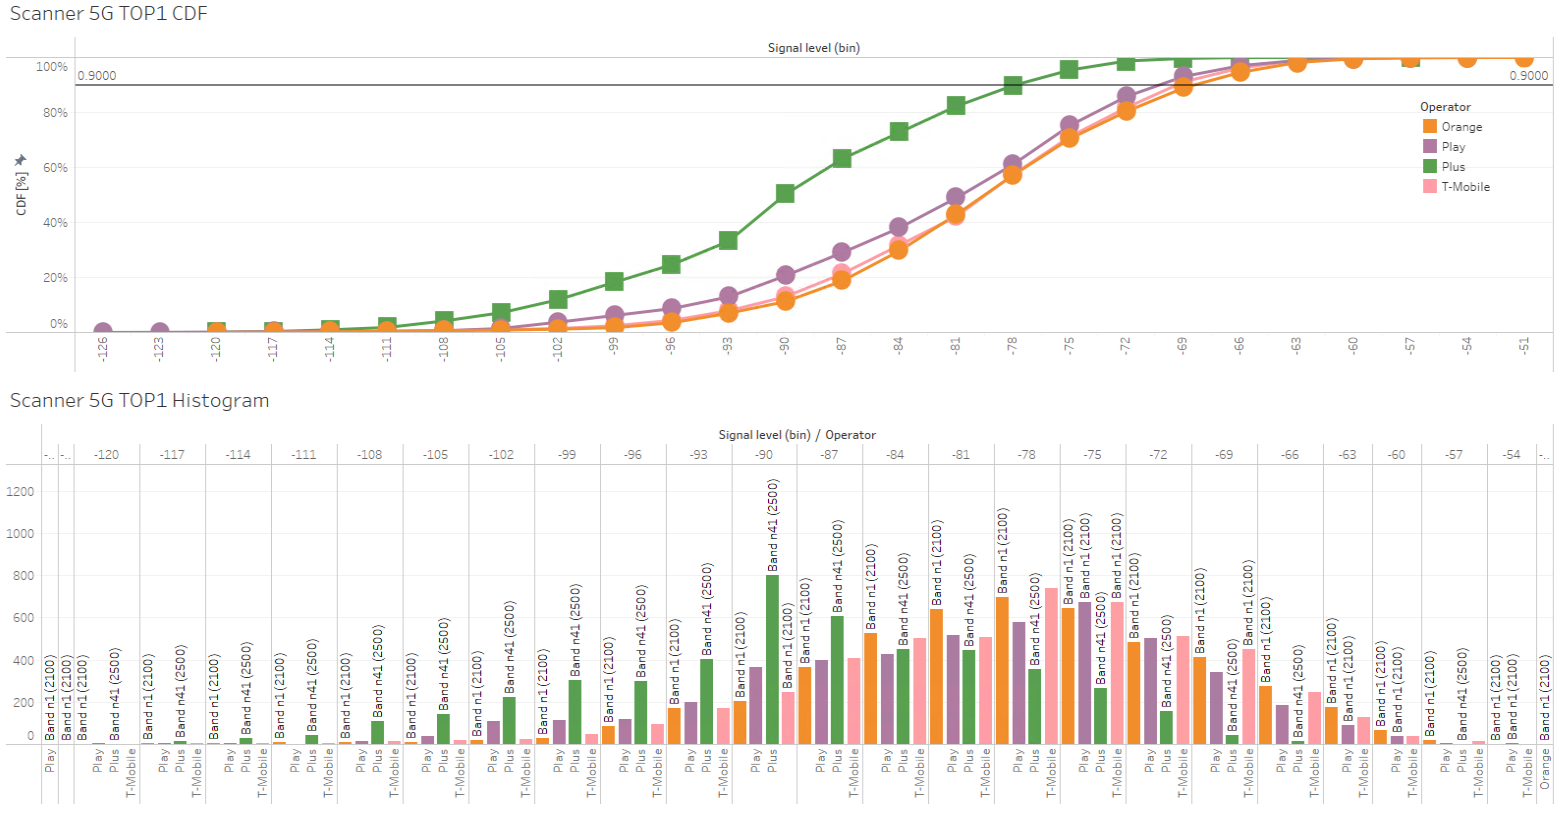
Looking at the charts above, Plus appears to have weaker 5G signal strength (average PSS RP = -88 dBm), while T-Mobile and Orange average a PSS RP = -78 dBm and Play averages PSS RP = -80 dBm. This could be due to the difference in the frequency at which Plus operates (band 41 – 2500MHz) compared to other operators (band 1 – 2100MHz). Network parameterisation might also impact the signal strength.
Key findings of the Drive Test in Warsaw (2023)
As of June 2023, a significant development in mobile operator infrastructure is visible in Warsaw, reflected in the near-universal availability of 5G services and better results compared to the test conducted at the end of 2022.
Similar to previous analyses, the Plus network achieves the best indicators for potential Internet download speeds. For uploads, T-Mobile presents the best results.
It’s noteworthy that the current measurement compares the quality of traditional voice services (VoLTE) and those provided via popular OTT applications such as WhatsApp or Microsoft Teams. All operators’ infrastructure enables very good quality voice calls for OTT applications in Warsaw, mainly due to the extensive 5G coverage.
This time, we also tested network quality for delivering an online gaming access service, where quality is affected by latency and packet loss. Here, the TWAMP – Interactivity Score test provides useful insights.
This is significant because the rising popularity of e-sports and online gaming demands high-quality connections from operators to minimise latency and packet loss. In this regard, the TWAMP test results are crucial for evaluating the quality of service provided by individual operators.


Leave a Comment
Your email address will not be published. Required fields are marked with *